Here’s a list of average gas prices in the USA since 1978 when Jimmy Carter was president. The list shows the average price of gas each year and who was president at the time along with their political party. See if you think there is any correlation between gas prices, presidents, democrats and republicans.
Gas prices show up in every election, every news cycle, and every argument about who’s doing a good job running the country. But the raw number on the pump sign is one of the most misleading statistics in politics. Here’s why and what the numbers actually show when you look at them honestly.
Why does this matter? If you only look at the pump price, you can easily be misled in either direction. Raw prices make recent years look worse than they sometimes are, and make old “cheap gas” eras look better than they actually were for people’s wallets. All three views together give you the full picture.
Bottom line: Use all three views in the interactive chart below. If someone tells you gas prices prove their party is better or worse, ask them which measure they’re using and whether they’ve adjusted for inflation. The honest answer is almost always more complicated, and more interesting, than the talking points suggest.
Compare nominal price vs. inflation-adjusted cost vs. impact on workers
Select a view:
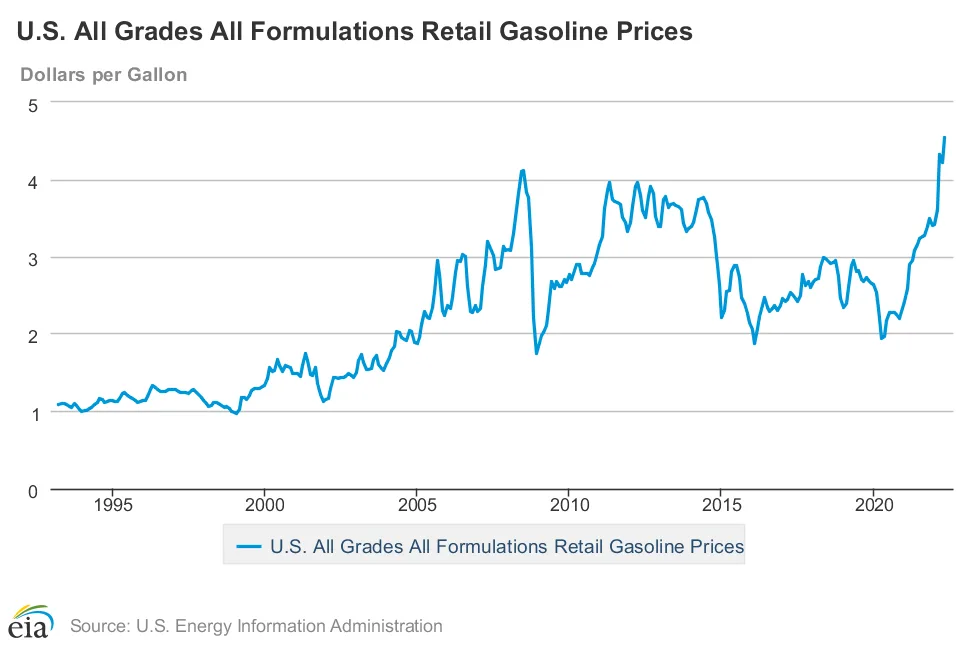
Gas Prices: Nominal vs Inflation-Adjusted
Interactive view of U.S. gas prices by year. Inflation-adjusted values use approximate 2026-dollar conversion factors.
Nominal price > the number on the pump.
This is the raw dollar amount you see when you pull up to the gas station. It’s real, it’s what comes out of your wallet, and it’s what gets quoted on the news. But it has a big problem: a dollar in 1981 bought a lot more than a dollar today. Comparing pump prices across decades without adjusting for that is like comparing your dad’s $20,000 salary in 1985 to a $20,000 salary today. Same number, very different reality.
Inflation-adjusted price > what gas actually cost in real terms
This converts every year’s gas price into 2025 dollars so you can make a fair comparison across time. When you do this, some surprises jump out. Gas in the early 1980s — which people remember as “cheap” — was actually among the most expensive in history once you account for inflation. And the 2022 price spike, while painful, wasn’t the all-time record it felt like. The inflation-adjusted view is the most honest way to compare prices across different decades.
Minutes of work per gallon > the most human measure
This one asks a simple question: how long does the average worker have to work to afford one gallon of gas? It automatically accounts for both inflation and wage growth at the same time. When this number is high, gas is genuinely hurting people’s budgets. When it’s low, people have more breathing room even if the pump price looks high. By this measure, 1981 was the hardest year on record — workers needed over 8 minutes of labor per gallon. Recent years, while frustrating, have generally been easier than the early 1980s.
Here it is as clean paragraphs with headings — ready to paste into standard Gutenberg paragraph and heading blocks, or as one HTML block if you prefer.
Presidents don’t set oil prices — but their decisions matter
No president can call OPEC and order cheaper gas. Oil is bought and sold on a global market that responds to supply, demand, and world events — things largely outside any one leader’s direct control. But that doesn’t mean presidents are off the hook entirely. The decisions a president makes — going to war, imposing sanctions, expanding or restricting domestic drilling, managing foreign alliances — can directly trigger or worsen the very events that move prices.
In other words, a president may not control the oil market, but they can absolutely influence the conditions that shake it.
The 2003 Iraq invasion was a U.S. policy choice that destabilized a major oil-producing region and contributed to years of rising prices that followed. Sanctions on Iran — applied and lifted by different administrations — directly affect how much Iranian oil reaches the global market. Domestic drilling and pipeline policy shapes U.S. oil output, which can cushion or amplify global price swings. And strategic alliances with Saudi Arabia and other producers influence OPEC decisions on supply — relationships that have varied significantly from one administration to the next.
The fairest way to read this data: world events drive prices, but presidents sometimes help create those world events. The pump price alone can’t tell you which is which — that takes looking at the full context of what was happening and what decisions were made.
Presidents inherit the market their predecessor left
Gas prices respond to policies and world events with a lag — often 12 to 24 months or more. A president who takes office during a global supply shock will see high prices on day one through no fault of their own. Likewise, a president who benefits from falling oil prices might get credit for something that started before they arrived. Blaming or crediting any president for gas prices in their first year is almost always unfair — in either direction.
Both parties have had high prices and low prices
Neither party has a clean record. Prices rose sharply under Republican and Democratic presidents alike — and fell under both as well. The pattern that stands out most clearly isn’t partisan: it’s a mix of global markets, geopolitical decisions, and policy choices that cross party lines. Wars, oil embargoes, and global recessions drive the spikes — but as noted above, some of those events had American fingerprints on them.
Year > Gas Price > Political Party (President)
- IRAN REVOLUTION
- 1978 > $0.65 > Democrat (Carter)
- 1979 > $0.88 > Democrat (Carter)
- SOVIETS INVADE AFGHANISTAN
- 1980 > $1.22 > Democrat (Carter)
- IRAN/IRAQ WAR
- 1981 > $1.35 > Democrat (Carter)
- 1982 > $1.28 > Republican (Reagan)
- 1983 > $1.23 > Republican (Reagan)
- 1984 > $1.20 > Republican (Reagan)
- 1985 > $1.20 > Republican (Reagan)
- 1986 > $0.93 > Republican (Reagan)
- 1987 > $0.96 > Republican (Reagan)
- 1988 > $0.96 > Republican (Reagan)
- 1989 > $1.06 > Republican (Reagan)
- FALL OF BERLIN WALL
- 1990 > $1.22 > Republican (Bush)
- 1991 > $1.20 > Republican (Bush)
- COLLAPSE OF SOVIET UNION
- 1992 > $1.19 > Republican (Bush)
- 1993 > $1.17 > Republican (Bush)
- 1994 > $1.17 > Democrat (Clinton)
- 1995 > $1.21 > Democrat (Clinton)
- 1996 > $1.29 > Democrat (Clinton)
- 1997 > $1.29 > Democrat (Clinton)
- 1998 > $1.12 > Democrat (Clinton)
- 1999 > $1.22 > Democrat (Clinton)
- 2000 > $1.56 > Democrat (Clinton)
- 2001 > $1.53 > Democrat (Clinton)
- WORLD TRADE CENTER ATTACK
- 2002 > $1.44 > Republican (Bush Jr.)
- 2003 > $1.64 > Republican (Bush Jr.)
- UNITED STATES INVADES IRAQ
- 2004 > $1.92 > Republican (Bush Jr.)
- 2005 > $2.34 > Republican (Bush Jr.)
- 2006 > $2.64 > Republican (Bush Jr.)
- 2007 > $2.85 > Republican (Bush Jr.)
- 2008 > $3.32 > Republican (Bush Jr.)
- USA STOCK MARKET CRASH
- 2009 > $2.40 > Republican (Bush Jr.)
- 2010 > $2.84 > Democrat (Obama)
- 2011 > $3.58 > Democrat (Obama)
- 2012 > $3.70 > Democrat (Obama)
- 2013 > $3.58 > Democrat (Obama)
- 2014 > $3.43 > Democrat (Obama)
- 2015 > $2.51 > Democrat (Obama)
- 2016 > $2.20 > Democrat (Obama)
- 2017 > $2.47 > Democrat (Obama)
- 2018 > $2.79 > Republican (Trump)
- 2019 > $2.70 > Republican (Trump)
- COVID19
- 2020 > $2.24 > Republican (Trump)
- 2021 > $3.13 > Republican (Trump)
- 2022 > $4.50 > Democrat (Biden)
- RUSSIA INVADES UKRAINE
- 2023 > $3.63 > Democrat (Biden)
- 2024 > $3.42 > Democrat (Biden)
- 2025 > $3.22 > Democrat (Biden)
- U.S.-ISRAEL-IRAN CONFLICT
- 2026 > $4.09 > Republican (Trump)*
Summary of Data Points & Global Events
- 2001 – World Trade Center Attack: Following the 9/11 attacks, prices initially saw volatility but remained relatively low ($1.53) compared to later years as the global economy processed the shock and travel decreased.
- 2003 – United States Invades Iraq: The onset of the Iraq War signaled the beginning of a long-term upward trend in fuel prices. Concerns over Middle Eastern oil stability pushed prices from $1.64 toward the $2.00 mark.
- 2008 – USA Stock Market Crash: Prices hit a then-record high of $3.32 before the financial crisis took full hold. The subsequent Great Recession led to a sharp drop in demand, reflected in the 2009 dip to $2.40.
- 2020 – COVID-19 & Political Turmoil: The global pandemic caused an unprecedented collapse in travel and oil demand, bottoming prices out at an annual average of $2.24.
- 2022 – Russia Invades Ukraine: The invasion in February 2022 led to immediate sanctions on Russian energy and a massive spike in global oil prices. This resulted in the 2022 average of $4.50, the highest in the dataset.
- 2023–2024 – Red Sea Shipping Crisis: Attacks on commercial vessels in the Bab el-Mandeb Strait forced tankers to take longer routes around Africa. While U.S. domestic production kept annual averages lower than 2022 ($3.63 and $3.42), these events caused persistent localized price fluctuations.
- 2026 – U.S.-Israel-Iran Conflict: The most recent data from March 2026 shows a sharp escalation in prices (reaching $4.09). This spike is attributed to direct military engagements in the Middle East, sparking fears of a total blockade of the Strait of Hormuz, through which a fifth of the world’s oil passes.
Maximize Your MPG: Top Products & Tips
With gas prices on the rise, getting every mile possible out of your tank is a priority. While there is no “magic additive” that doubles your mileage, these proven tools and maintenance habits help restore lost efficiency and keep your engine running at its factory peak.
Recommended Gear to Save Fuel
Chevron Techron Concentrate
The gold standard for cleaning fuel injectors and removing carbon buildup that steals your MPG.
Check Price on AmazonJaco ElitePro Gauge
Under-inflated tires increase rolling resistance. Use a high-accuracy gauge to stay at your car’s ideal PSI.
Check Price on AmazonBlueDriver Pro OBD2
Monitor your fuel consumption in real-time and find hidden engine faults that waste gasoline.
Check Price on AmazonEssential Fuel-Saving Tips
- Check Tires Monthly: For every 1 PSI drop in all four tires, your fuel economy can dip by 0.2%.
- Limit Idling: If you’re parked for more than 60 seconds, turn off the engine. Idling can burn up to a half-gallon of fuel per hour.
- Smooth Acceleration: Aggressive driving (hard starts and stops) can lower your gas mileage by up to 30% on the highway.
- Lighten the Load: Every extra 100 lbs in your vehicle reduces your fuel economy by about 1%.